Introducing myself
- Scott Lystig Fritchie
- Senior Software Engineer at Basho Japan KK
- Email: <scott@basho.com>
- Twitter:
@slfritchie - UNIX, Erlang and me:
- UNIX sysadmin & programmer since 1986
- Erlang programmer since 2000
- Publications by USENIX and the ACM
- Speaker at Erlang User Conference and Erlang Factory
Introducing today's presentation
- Today's presentation: http://twitter.com/slfritchie
- Long term: http://www.snookles.com/erlang/ef2015/
- Today's flame graphs: https://github.com/slfritchie/eflame
- Today's Erlang hacks: https://github.com/slfritchie/otp
- Flame graph home: https://github.com/brendangregg/FlameGraph
- General introduction: http://www.brendangregg.com/flamegraphs.html
Today's focus: profiling Erlang code
- You have identified code to profile, based on "USE Method" or
other measurement-based methodology.
- Examine a specific module
- Examine a specific subsystem/OTP application
- Not sure where to start: examine an entire system under a specific workload.
- Guesses are wrong 127% of the time.
- Be skeptical: doubt your measurements, verify them!
- Multiple methods
- Experiment while your test is running!
- Beard definitely not required!
Today's focus: GOAL for profiling Erlang code
- Identify the Erlang function(s) that is consuming the most CPU resource.
- Either wall-clock time or "on scheduler" time
- Depends on the measurement method
From Brendan Gregg: "Systems Performance" author

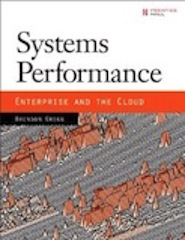
- Most advice about benchmarking is also valid advice for profiling.
- source: https:
//pbs.twimg.com/profile_images/512451438572613632/3T6mju_J.jpeg, http: //www.brendangregg.com/Images/systemsperf_cover_123.jpeg
Brendan Gregg: "Passive Benchmarking"
- Pick a benchmark tool.
- Run it with a variety of options.
- Make a slide deck of the results.
- Hand the slides to management.
Brendan Gregg: "Casual Benchmarking"
- You benchmark A,
- but actually measure B,
- and conclude you've measured C
Brendan Gregg: "Active Benchmarking"
.
"You analyze performance while the benchmark is running – not just after it's done – using other tools."
Why? Confirm that you really understand:
- What does the test actually do?
- How the system under test actually respond to the test?
- What are the true limiters of the system under test?
- What are the true limiters of the test itself?
Active Benchmarking -> Active profiling
.
"You analyze performance while the system is running – not just after it's done – using other tools."
Why? Confirm that you really understand:
- What does the workload actually do?
- How the code under test actually respond to the workload?
- What are the true limiters of the code under test?
- What are the true limiters of the profiler tool itself?
From Martin Kjellin & Roberto Aloi: Profiling & Debugging Erlang Systems

Kjellin & Aloi: Profiling Mindset
- Measure, don't guess.
- Trust your measurements.
- Measure before optimizing.
- Know what you're measuring.
Lukas Larsson, Erlang VM Developer @ Erlang Solutions & Ericsson
"[Profiling is] Inherently difficult, you have to be aware of the entire stack."
sources: https://www.erlang-solutions.com/resources/webinars/understanding-erlang-scheduler (about minute 31), http://www.erlang-factory.com/euc2014/lukas-larsson
Garrett Smith: "Erlang is an operating system for your code"
- You need to understand the major components of the system:
- How OS threads are used by Erlang schedulers, async I/O pool, etc.
- Memory management: allocation, garbage collection, VM allocators, …
- Types of Erlang processes & what they do.
- Message passing patterns: send/receive within a node? across nodes? Mailbox sizes
- Erlang file I/O doesn't work like most other languages'
- Message passing <-> file port driver!
- Support for "diskless" mode is still there!
- Data shared by ETS tables really isn't shared: it's copied
on-demand in & out of ETS tables <-> Erlang process heaps
- Except for "large" Erlang binary terms! ^_^
If you don't know where to start, try The USE Method
- Measure these three things:
- Utilization (% busy/utilized)
- Saturation rates (items queued due to 100% utilization)
- Errors
- Find largest source of errors, or saturation, or utilization
- Re-focus USE method on that thing you found.
- Perhaps fix that bottleneck. Go to #1 if not fast enough.
- http://dtrace.org/blogs/brendan/2012/02/29/the-use-method/
Kjellin & Aloi: What to look for!
- OS level
- memory usage, disk I/O & I/O wait, CPU usage, network usage,…
- Erlang
- elapsed wall clock time, message queues, reductions executed, garbage collection events, process scheduler events, …
Survey: Erlang profiling tools available today
- Not enough time to talk about them all!
- Use your favorite Web search tool to find more info about them.
- Afterward, I'll focus on flame graphs
Survey: Inside OTP source & OTP docs:
cprofandepofandfprofetopandpmanandobserverttbperceptandpercept2(http://www.erlang-factory.com/upload/presentations/808/Percept2.pdf)instrumentlcnt- "Efficiency Guide User's Guide" in OTP docs
Survey: Outside of OTP but focused on Erlang
- https://github.com/massemanet/eper package: redbug and dtop
- https://github.com/ferd/recon package and his "Stuff Goes Bad: Erlang in Anger" ebook
riak_sysmon&cluster_info@ https://github.com/basho/- https://github.com/virtan/eep +
kcachegrind - https://github.com/isacssouza/erlgrind
- Erlang VM internals:
- gprof, Valgrind, other C/assembly profilers, DTrace/SystemTap
- Don't forget OS tools!
top,htop,sar,iostat,vmstat,strace,sysdig, …
Other measurement techniques
- timer:tc/1, /2, /3
- Beware! CLI code is interpreted differently than compiled code!
latency_histogram_tracer.erl- Create detailed histogram stats on latencies of Mod:Fun/Arity calls.
- https://gist.github.com/slfritchie/159a8ce1f49fc03c77c6
- Requires
folsompackage for histograms
- Adding dynamic tracing probes for DTrace/SystemTap measurements.
- For example,
dyntrace:pn(25,1)anddyntrace:pn(25,2)additions to your code. - Measure latencies with a D script between
erlang$pid::user_probe-n25probes with arg=1 vs. arg=2 - Requires
dyntracesupport compiled into your VM
- For example,
latency_histogram_tracer example output
%% For example: create a histogram of call latencies
%% for bitcask:put/3. Watch for 10 seconds. units=usec

> latency_histogram_tracer:start(bitcask, put, 3, 10).
... wait 10 seconds ...
Histogram stats:
[{min,0},
 {max,48},
 {arithmetic_mean,2.765411819271055},
 {median,3},
 {variance,3.5629207473971585},
 {standard_deviation,1.8875700642352746},
 {percentile,[{50,3},{75,4},{90,5},{95,6},{99,8},{999,14}]},
 {n,51746},
 {histogram,[{1,13436},
             {2,12304},
             {3,10789},
             {4,7397},
             {5,4191},
Variable CPU clock speed
- You turned it off, didn't you?
Erlang tracing via dbg and erlang BIFs.
- It's simple. And it's complex. It's both!
- For each event, send a message to a single "event tracer"
process/port.
- The consumer/destination/sink for trace messages
Erlang tracing: What can be an event producer?
- Any Erlang process
- Any Erlang port
- The scheduler threads
Erlang tracing: What Erlang processes can generate events?
- Any 1/N/all processes running right now
- Any processes spawned after tracing starts
- Any processes linked after tracing starts
Erlang tracing: Types of event messages
- Calling a function (global or local)
- filter based on:
- module name
- function name
- # of arguments
- Erlang-style pattern matching on func's argument list!
- filter based on:
- Sending/receiving a message
- Process is starting/stopping GC
- Process is running/stopped by scheduler thread
- Process has exited
What do trace messages look like?
%% Function call, no timestamp
{trace, Pid, call, MFA}

% Function call, with timestamp w/extra binary() info
{trace_ts, Pid, call, MFA, TS}
{trace_ts, Pid, call, MFA, BIN, TS}

% Garbage collection events & stats, with timestamp
{trace_ts, Pid, gc_start, StatsTerm, TS}
{trace_ts, Pid, gc_end, StatsTerm, TS}

% Process scheduler in & out events, with timestamp
{trace_ts, Pid, in, MFA, TS}
{trace_ts, Pid, out, MFA, TS}
Trace message examples
%% Full arguments of each traced function

    {trace_ts, <0.450.0>, call,
     {erlang,monitor,[<0.49.0>]}, {1426,225,821772}}

%% If 'arity' trace flag is specified, just arity #

    {trace_ts, <0.450.0>, call, {erlang,monitor,1},
     <<"Extra info here.....">>, {1426,225,821772}}
    {trace_ts, <0.450.0>, return_from,
     {erlang,monitor,1}, true, {1426,225,821774}}
Erlang tracing: Strengths
- Turn on and off anytime
- On developer's laptop
- On production system!
- The API is odd, but the pattern matching is powerful
- "Event tracer"/consumer can execute any Erlang code
- Turing complete, very flexible
Erlang tracing: Weaknesses
- Turn on and off anytime
- On production system! And forget to turn it off.
- The API is frequently difficult to remember
- That's the reason for so many tools to manage the low-level tracing API
- Only 1 event tracer per VM
- Easy to create "event tsunami" of millions of event messages
- Killing entire VMs in production = not fun
- TCP and file port tracers have lower overhead but not low enough
- Capacity limit: 1 tracer = 1 CPU core of work available
- Easy to create "event tsunami" of millions of event messages
The fprof profiling tool: Advantages
- API is mostly easy-to-use
- Measure wall-clock execution time of {Mod, Func, ArgList}
- Easy to measure pure function {Mod, Func, ArgList} time!
- Aware of call stacks:
- Time executed by function F
- Time executed by functions called by function F
- Implemented by Erlang tracing
- Use it in production, if you wish….
The fprof profiling tool: Disadvantages
- Report format requires some practice to read correctly
erlgrindandeephave better (?) visualization tools
- Not designed for multi-process measurements
- Call stack interpretation can be ok or terrible
- Implemented by Erlang tracing
- High overhead: 1 message per function call or return
- Only 1 consumer process/port
- Can slow down a Riak system by 2-3 orders of magnitude!
Hyperbole: Flame Graphs are Awesome!
The "flame graph" profiling tool
- Invented by Sun Microsystems alumni as an alternative way of visualizing profiling data with call stacks.
- Originally based DTrace + Solaris
- Very quickly ported to many other platforms
- Links:
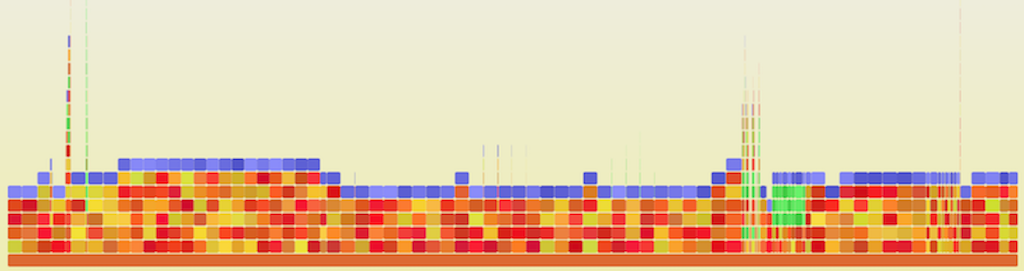
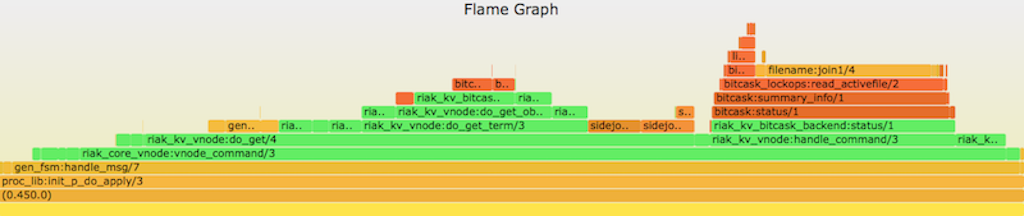
Flame Graph Example
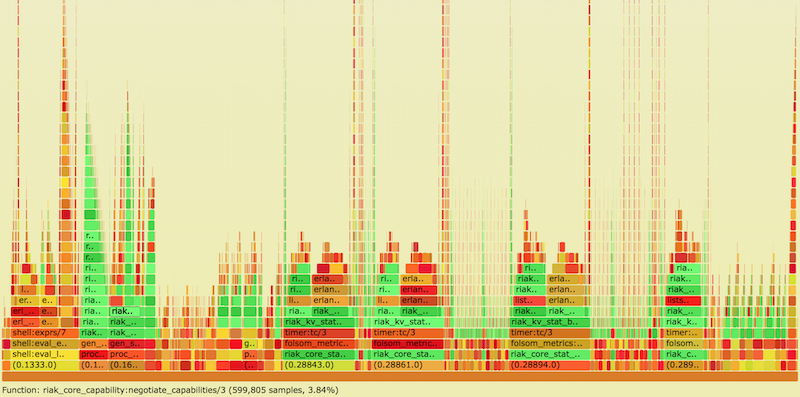
Source: www.snookles.com/scotttmp/eflame2/riak.1.svg
Flame Graph Example
- Y axis: call stack depth
- X axis: proportion of # of samples (or perhaps relative execution time)
- Left-to-right order is alphabetical
- Left-to-right order has nothing to do with passage of time
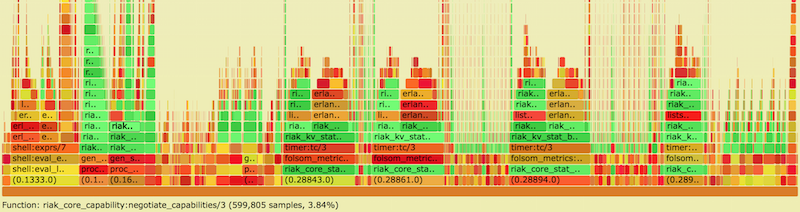
Flame Graph Example
- Y axis: call stack depth
- X axis: proportion of # of samples (or perhaps relative execution time)
- Left-to-right order is alphabetical
- Left-to-right order has nothing to do with passage of time
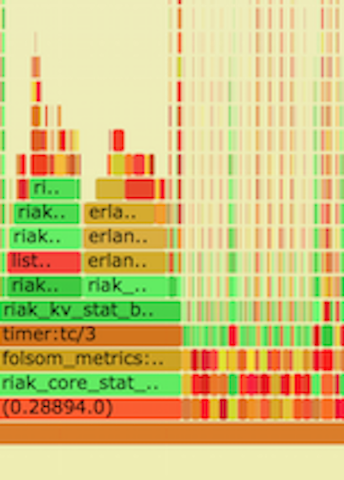
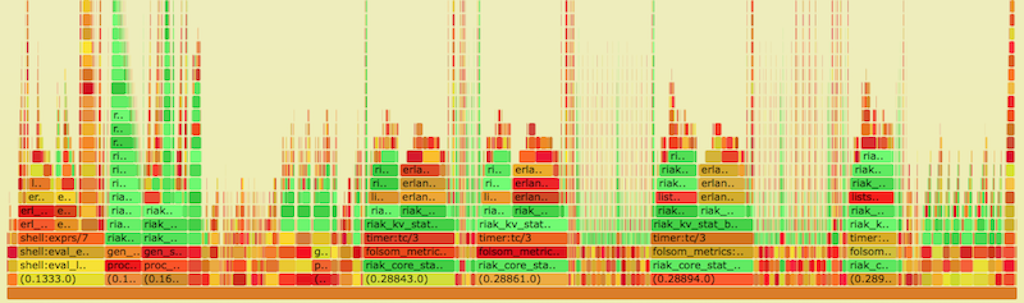
Flame Graph of Experimental Riak 1
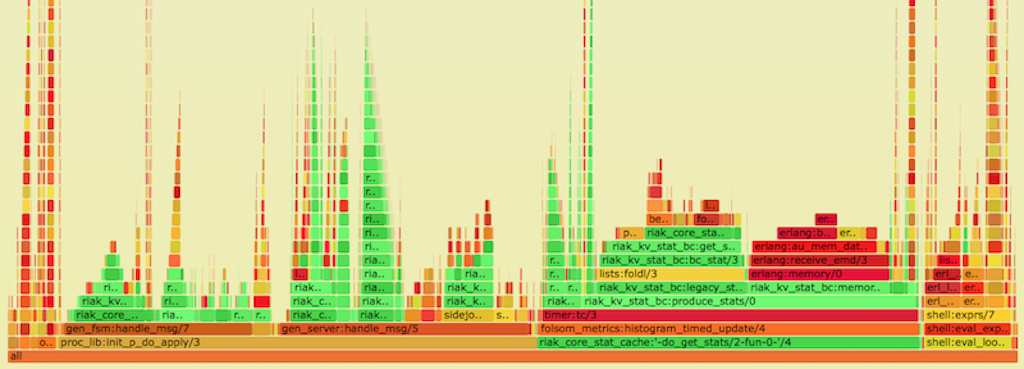
Flame Graph of Experimental Riak 2
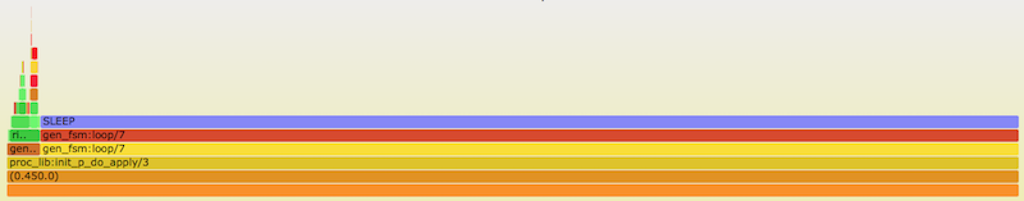
Flame Graph of Experimental Riak 3
Flame Graph of Experimental Riak 4
Flame Graph of Experimental Riak 5
Making flame graphs with Erlang
- Method 1: profile the VM itself using standard profiling
techniques + Gregg's flame graph toolkit
- Good view into the VM's internal implementation
- Not good view into Erlang code behavior
- Method 2: Vlad Ki's
eflamelibrary- https://github.com/proger/eflame
- Uses Erlang tracing (all strengths & weaknesses)
- Not always accurate call stack reporting
- Method 3: Scott Lystig Fritchie's
eflame2library- https://github.com/slfritchie/eflame
- Uses alternate call stack calculation
- Can use Erlang tracing (all strengths & weaknesses)
- Can use patched Erlang VM for much lower overhead cost
- Easier-to-use API, perhaps, I hope?
- Not always accurate call stack reporting
Steps to create a flame graph
- Start workload on system. (And keep it running!)
- Trigger measurement framework (previous slide)
- Convert raw measurement format to standard flame graph file format.
- Generate flame graph's native SVG format.
- Convert SVG to other formats.
- Not all Web browsers have native SVG support yet {sigh}
Making flamegraphs with eflame2 library: getting ready
git clone https://github.com/slfritchie/eflame.gitcd eflamemake- Copy the
ebin/eflame2.beamfile to/tmpon whatever machine it is that you wish to use to generate a flame graph. (Call it the System Under Test or SUT.) - Run
code:add_pathz("/tmp").at the Erlang CLI on the SUT.
Making flamegraphs with eflame2 library: collecting traces, make graph
- Start the workload on the SUT.
- Collect some traces:
- For example, to gather trace events on all processes and all newly-spawned processes for all global function calls for 10 seconds (10,000 milliseconds).
- Run
eflame2:write_trace( global_calls_plus_new_procs,
     "/tmp/ef.test.0", all, 10*1000).
Making flamegraphs with eflame2 library: collecting traces, make graph
- Convert the binary trace to an ASCII trace:
- Run
eflame2:format_trace("/tmp/ef.test.0", "/tmp/ef.test.0.out").
- Run
- Convert the ASCII trace to an SVG flame graph image:
- Run at a BASH/C Shell/login shell:
cat /tmp/ef.test.0.out | flamegraph.riak-color.pl > output.svg
- Run at a BASH/C Shell/login shell:
eflame2: Call stack calculation, version #1
- Use little-documented [process_dump] match spec action.
- e.g.,
MatchSpec = [{'_',[],[{message,{process_dump}}]}]
- e.g.,
- Create same process summary text that's used for Erlang
erl_core.dumpfiles at crash time! - On a Riak system, each trace message can be 15 KBytes or more!
- Parse the Erlang function call info (and throw the rest away).
eflame2: Call stack calculation, version #1 (verbose!)
=proc:<0.450.0>
State: Running
Spawned as: proc_lib:init_p/5
Last scheduled in for: gen:do_call/4
Spawned by: <0.151.0>
Started: Thu Mar 12 15:59:47 2015
Message queue length: 2
Message queue: [{'$gen_event',{riak_vnode_req_v1,1096126227998177188652763624537212264741949407232,{fsm,undefined,<0.16617.8>},{riak_kv_put_req_v1,{<<11 bytes>>,<<4 bytes>>},{r_object,<<11 bytes>>,<<4 bytes>>,[{r_content,{dict,3,16,16,8,80,48,{[],[],[],[],[],[],[],[],[],[],[],[],[],[],[],[]},{{[],[],[],[],[],[],[],[],[],[],[[<<11 bytes>>,53,72,122,99,54,118,108,49,119,78,56,115,86,84,109,117,67,110,85,86,112,88]],[[<<5 bytes>>]],[],[[<<20 bytes>>|{1426,218816,52272}]],[],[]}}},<<4 bytes>>}],[{<<8 bytes>>,{19,63593438016}}],{dict,1,16,16,8,80,48,{[],[],[],[],[],[],[],[],[],[],[],[],[],[],[],[]},{{[],[],[],[],[],[],[],[],[],[],[],[],[],[],[[clean|true]],[]}}},undefined},101334680,63593438016,[]}}},{'$gen_event',{riak_vnode_req_v1,1096126227998177188652763624537212264741949407232,{fsm,undefined,<0.16618.8>},{riak_kv_put_req_v1,{<<11 bytes>>,<<4 bytes>>},{r_object,<<11 bytes>>,<<4 bytes>>,[{r_content,{dict,3,16,16,8,80,48,{[],[],[],[],[],[],[],[],[],[],[],[],[],[],[],[]},{{[],[],[],[],[],[],[],[],[],[],[[<<11 bytes>>,50,80,116,110,68,53,82,119,105,85,65,56,113,77,51,103,85,121,80,54,72,76]],[[<<5 bytes>>]],[],[[<<20 bytes>>|{1426,218816,53566}]],[],[]}}},<<4 bytes>>}],[],{dict,1,16,16,8,80,48,{[],[],[],[],[],[],[],[],[],[],[],[],[],[],[],[]},{{[],[],[],[],[],[],[],[],[],[],[],[],[],[],[[clean|true]],[]}}},undefined},54710744,63593438016,[coord]}}}]
Number of heap fragments: 0
Heap fragment data: 0
Link list: []
Dictionary: [{#Ref<0.0.0.1416>,{bc_state,"./data/bitcask/1096126227998177188652763624537212264741949407232",{filestate,read_write,"./data/bitcask/1096126227998177188652763624537212264741949407232/1.bitcask.data",1,<0.1927.7>,<0.1929.7>,3479991403,35986},<<0 bytes>>,[{filestate,read_only,"./data/bitcask/1096126227998177188652763624537212264741949407232/1.bitcask.data",1,<0.4908.7>,undefined,0,0}],2147483648,[{expiry_secs,-1},{vnode_vclocks,true},{included_applications,[]},{allow_strfun,false},{reduce_js_vm_count,6},{anti_entropy_build_limit,{1,3600000}},{storage_backend,riak_kv_bitcask_backend},{hook_js_vm_count,2},{anti_entropy_leveldb_opts,[{write_buffer_size,4194304},{max_open_files,20}]},{listkeys_backpressure,true},{anti_entropy,{on,[]}},{mapred_name,"mapred"},{stats_urlpath,"stats"},{legacy_stats,true},{aae_throttle_limits,[{-1,0},{200,10},{500,50},{750,250},{900,1000},{1100,5000}]},{aae_throttle_sleep_time,0},{js_thread_stack,16},{anti_entropy_data_dir,"./data/anti_entropy"},{anti_entropy_expire,604800000},{warn_siblings,25},{anti_entropy_concurrency,2},{add_paths,[]},{fsm_limit,50000},{anti_entropy_tick,15000},{http_url_encoding,on},{map_js_vm_count,8},{object_format,v1},{mapred_2i_pipe,true},{warn_object_size,5000000},{js_max_vm_mem,8},{read_write,true}],<<0 bytes>>}},{bitcask_efile_port,#Port<0.11417>},{'$initial_call',{riak_core_vnode,init,1}},{bitcask_time_fudge,no_testing},{bitcask_file_mod,bitcask_file},{hashtree_tokens,35},{'$ancestors',[riak_core_vnode_sup,riak_core_sup,<0.148.0>]},{random_seed,{27839,21123,25074}}]
Reductions: 1941240
Stack+heap: 4181
OldHeap: 0
Heap unused: 1619
OldHeap unused: 0
Stack dump:
Program counter: 0x000000001c0c3ca8 (gen:do_call/4 + 576)
CP: 0x000000001c0c3c80 (gen:do_call/4 + 536)

0x0000000035f704b8 Return addr 0x000000001e81a220 (gen_server:call/3 + 128)
y(0)     #Ref<0.0.6.80948>
y(1)     'riak@127.0.0.1'
y(2)     Catch 0x000000001c0c3c90 (gen:do_call/4 + 552)
y(3)     infinity
y(4)     {file_pwrite,35986,[<<4 bytes>>,<<4 bytes>>,<<2 bytes>>,<<4 bytes>>,<<28 bytes>>,<<110 bytes>>]}
y(5)     '$gen_call'
y(6)     <0.1927.7>

[... lots more stuff omitted...]
eflame2: Call stack calculation, version #2
- Patch the Erlang VM to provide an alternate method of generating a
call stack report, without all of the extra/unwanted reporting stuff
that the
process_dumpmatch spec. - Added
process_backtracematch spec to write stack trace only - Much faster, much smaller trace messages.
- Use
eflame2:write_trace_exp/4oreflame2:write_trace_exp/6to use theprocess_backtracestyle trace generation.
Per-function-call tracing is expensive!
- A Riak system, tracing all processes, can slow down 50x-300x!
- Time-based sampling, like gprof or DTrace use, have very low overhead and can (given enough time) generate statistically valid profiles.
- But neither gprof nor DTrace can understand Erlang process stacks
- View the VM's C internals and not individual Erlang process state
- If you are a DTrace magician, please contact me!
Patching the VM for Scott's experimental hacks
git clone https://github.com/slfritchie/otp.gitcd otpgit checkout slf-profiling-tracing-hack1-v16./otp_build autoconf./configure --all-your-favorite-build-flags...make && make install
VM hacking: adding extra code to beam_emu.c's opcode interpreter loop
- Add new async thread that does nothing but:
- Sleep periodically
- Check global vars after waking up
- If global vars say "yes", set flags in each scheduler thread's
Processstructure to ask for a tracing sample.
VM hacking: adding extra code to beam_emu.c's opcode interpreter loop
void
goofus_timer_loop(useconds_t usecs_to_sleep)
{
    int ix;

    usleep(usecs_to_sleep);
    if (goofus_timer_enabled) {
        for (ix = 0; ix <= erts_no_schedulers; ix++) {
            ERTS_SCHEDULER_IX(ix)->goofus_count = 42;
        }
    }
    goofus_timer_loop(goofus_timer_sleep_msec * 1000);
}
VM hacking: adding extra code to beam_emu.c's opcode interpreter loop
- For each
OpCaseopcode inside ofprocess_main()- Add a check to see if a time-based sample should be dumped now.
- Added new field in
Processstructure. - If yes, write trace info directly to a file via
fwrite(3)
#define GOOFUS_CHECK
    if (ERTS_GET_SCHEDULER_DATA_FROM_PROC(c_p)     \
                              ->goofus_count != 0) \
        goofus_write_time_sample(c_p)
- Add GOOFUS_CHECK to lots of places….
VM hacking: adding extra code to beam_emu.c's opcode interpreter loop
int goofus_write_time_sample2(Process *c_p)
{
    erts_dsprintf_buf_t *dsbufp = NULL;
    char pidbuf[64];
    Eterm esp;

    if (goofus_fp == NULL || c_p == NULL) { return 0; }

    /* Format the message */
    dsbufp = erts_create_tmp_dsbuf(0);
    dtrace_proc_str(c_p, pidbuf);
    erts_print(ERTS_PRINT_DSBUF, (void *) dsbufp, "Pid %s\n", pidbuf);
    erts_stack_dump_abbreviated(ERTS_PRINT_DSBUF, (void *) dsbufp, c_p);
    erts_print(ERTS_PRINT_DSBUF, (void *) dsbufp, ".\n");
    fwrite(dsbufp->str, 1, dsbufp->str_len, goofus_fp);
    erts_destroy_tmp_dsbuf(dsbufp);
    return 1;
}
VM hacking: weaknesses of the beam_emu.c's opcode technique
- Add extra (ugly) statements to each opcode's implementation
- Could hide ugliness with even more macros!
^_^
- Could hide ugliness with even more macros!
- Cannot "see" activity such as GC or port deferred work
- Cannot "see" async file I/O activity directly
- Might add bias toward functions immediately after schedule in by scheduler? (Needs more investigation)
- Very low overhead, even when sampling every few milliseconds
- Appears to be more accurate (most of the time) than per-function trace events.
eflame2: Call stack calculation, version #3
- Clone & compile & install the Erlang/OTP repo described above.
- Start a workload on the SUT to be observed.
- Run the following at the Erlang shell:
VM hacking: using time-sampling for flame graphs
%% Open a trace file, /tmp/goofus.{OS-pid-number}.out
true = erlang:system_flag(debug_flags, open).

%% Set trace collection for every 7 milliseconds, then sleep for
%% about 1 second to wait for the change to take place.
erlang:system_flag(debug_flags, 7). timer:sleep(1000).

%% Turn off Erlang-trace-status-sensitive option and
%% turn on the asynchronous loop to request new samples
erlang:system_flag(debug_flags, disable_trace).
erlang:system_flag(debug_flags, asynchronous).

%% Let the workload run for some period of time.  Execute
%% the workload here if necessary.  Or wait a while with sleep.
timer:sleep(5*1000).

%% Turn off the tracing
erlang:system_flag(debug_flags, asynchronous).
true = erlang:system_flag(debug_flags, close).
VM hacking: using time-sampling for flame graphs
- Convert the trace file to flame-graph-ready input and then to an SVG flame graph.
/path/to/runtime_tools/priv/parse_goofus.pl \
    < /tmp/goofus.PID.out | sort | uniq -c | \
    awk '{ print $2, " ", $1}' | \
    flamegraph.riak-color.pl > /tmp/flame-graph.svg
What does the trace file look like?
Pid <0.34.0>
Program counter: 0x000000001a5b3ba8 (timer:sleep/1 + 64)
CP: 0x0000000000000000 (invalid)

0x1a201eb8 Return addr 0x1a4f43a0 (erl_eval:do_apply/6 + 376)
0x1a201ec8 Return addr 0x1a4b3d28 (shell:exprs/7 + 680)
0x1a201ee0 Return addr 0x1a4b3430 (shell:eval_exprs/7 + 144)
0x1a201f38 Return addr 0x1a4b3028 (shell:eval_loop/3 + 568)
0x1a201f70 Return addr 0x17fc8008 (<terminate process normally>)
.
Pid <0.7238.0>
[... repeat...]
Tutorial example, using Riak as a System Under Test
See https://github.com/slfritchie/eflame/blob/feature/alt-stack-method/README-Riak-Example.md for text and tutorial ideas here.
Reprise: Use "active benchmarking" / "active profiling"
- Don't assume function X is being called: confirm it
- Don't assume function X is fast: confirm it
- These measurement techniques have flaws
- Confirmation from multiple techniques builds confidence